
This is not a complete, "GCSE in a Nutshell" kind of page, more a collection of resources which you might find useful, alongside the approved text book for whichever exam board's GCSE you are studying. As with other pages on this site, this is still a young-ish site, and still growing. Keep coming back; there will be more. the thinking is more "how to tackle certain types of question" than an exhaustive coverage of any one syllabus. The analysis and presentation skills covered here should be useful to any exam board's Geography presentation.
Most boards present at least one "essay-type" question in one of their exams for GCSE Geography. It's usually worth a good chunk of the mark for that paper, so some practice, and some ideas of technique can be useful. A parent recently got in touch asking how to go about answering a question from an Eduqas GCSE textbook.
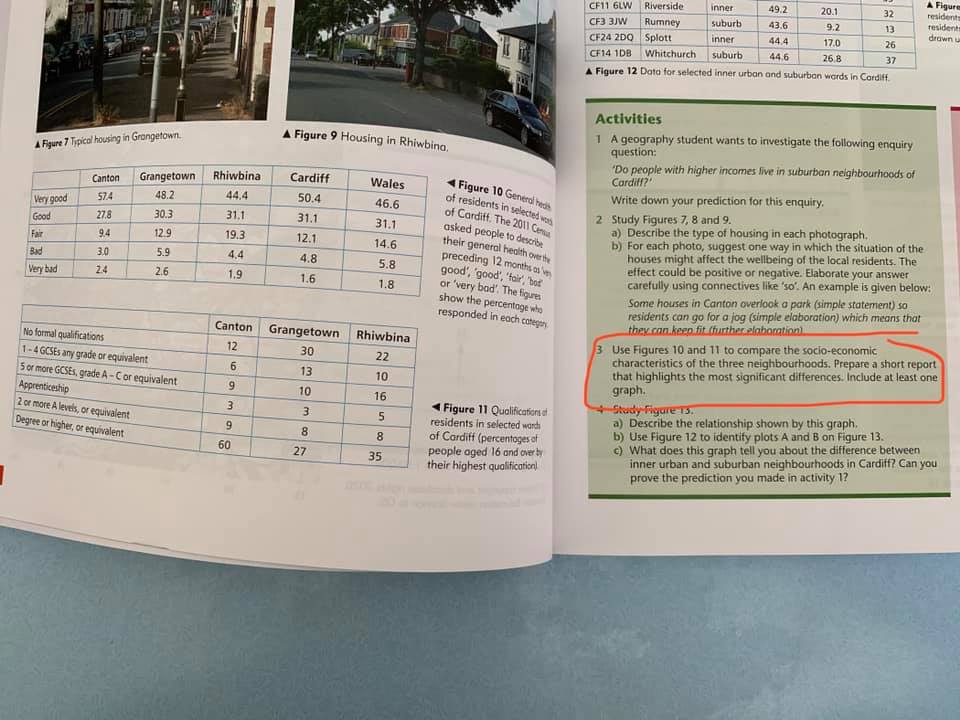
Please see link below to the question.
This is where I have suggested to students before now that they treat this aspect of Geography like an extension to Maths and Statistics.
A bit of data analysis, some graphs, bar-charts or pie diagrams to make the comparisons visually clearer, correct choice of data and interpretation...
There are usually clues in the text...
On Figure 11 (the education data), there are some categories where the data varies quite a lot; and others where the data is roughly the same across all 3 towns.
So the first thing to justify is "ignoring" data for apprenticeships, 2 or more A Levels, since those are the same or almost the same across all 3 towns.
Then start to look at what the biggest changes are, and extrapolate how that might seem to influence the difference in Fig 10 ... again, rows 1 and 3 [VG and Fair] would seem to be the ones to focus on.
Those graphs should quickly identify which education factors have the greatest influence on health, so a few sentences to explain the findings...
[... and this is a great example of why it works to treat a lot of the geography syllabus as maths & statistics (or data analysis if you want to be posh) - but that amounts to the same thing!]
Here's my first example graph - I'll give some advice on creating these in a moment, but here's my first graph:
[please see link to The "education" graph]
Analysis from this graph initially: we can already deduce that Apprenticeships and "2 or more A Levels or equivalent" are not going to be relevant to our analysis, since:
Notice also, on that graph, in towns where the number of graduates falls, it's the number of unqualified or "low qualified" that rises, NOT the number with apprenticeships or A Levels. [... probably another mark or two to be had there.]
It's great to get into this practice well before the exam - the more "familiar" exam conditions feel, the better the candidate (your student) will perform.
So - here's my initial graph from the upper data set (Ignoring Cardiff and Wales overall, as these data sets are not relevant to the question):
[See The "health" graph - stage 1]
... And here it is again, with a few "construction marks" removed; with the title underlined (there are usually a few marks to be had for presentation as well as spelling, grammar, punctuation...)
Now I have added three "trend lines", marked A, B, C - find some way these tie-in with the data on graph 1 (the education data) and discuss it.
You can dismiss the data for "bad" here, since it does not follow any trend.
You can dismiss the data for "Very Bad" since it is constant across all three locations.
... and there you have it.
Half a page to a page of neatly written explanations, and top marks on an essay-type analysis question (and yes, carefully prepared graphs count as part of an essay in Geography!)
[see The "health" graph - stage 2]
Looking at that first graph (education) again, I think my written answer might include something like "There is some relationship of trends, but it is not uniform or totally conclusive ...".
There may be a line to be found relating to the 5 or more GCSEs category; it may also be worth sketching a bar-graph with graduates and no formal education on top of each other - although how you explain that line ...
The towns are (intentionally) shown in the same order on both graphs. In graph 2 there are those three clear trend lines (A, B and C) - I'm struggling to find a similar, uniform trend in the education graph, although there seems to be some correlation, but nothing quite so uniform as on the health graphs - and the towns are in the same order on both graph ...
... and finally: there may be some additional data in the text of the question, which helps you to unravel that data a bit further.
Remember:
the more you practise these, the faster you will become at creating tidy graphs, and the quicker and more naturally you will identify trends in the data.
... and sometimes line graphs or even, occasionally, pie charts, may be more appropriate. For the data here, though, I suggest bar charts work best.
These questions are worth working on - a good mark in one of these can easily make a whole grade-point (sometimes more) difference to the final result.
Here's a list of "must have" kit to take into the exam to make sure nothing lets you down, and you have all you need:
There will be a few more ideas; come back occasionally!
For example, our friends at GCSE Revision Monkey have some excellent resources for Sciences.